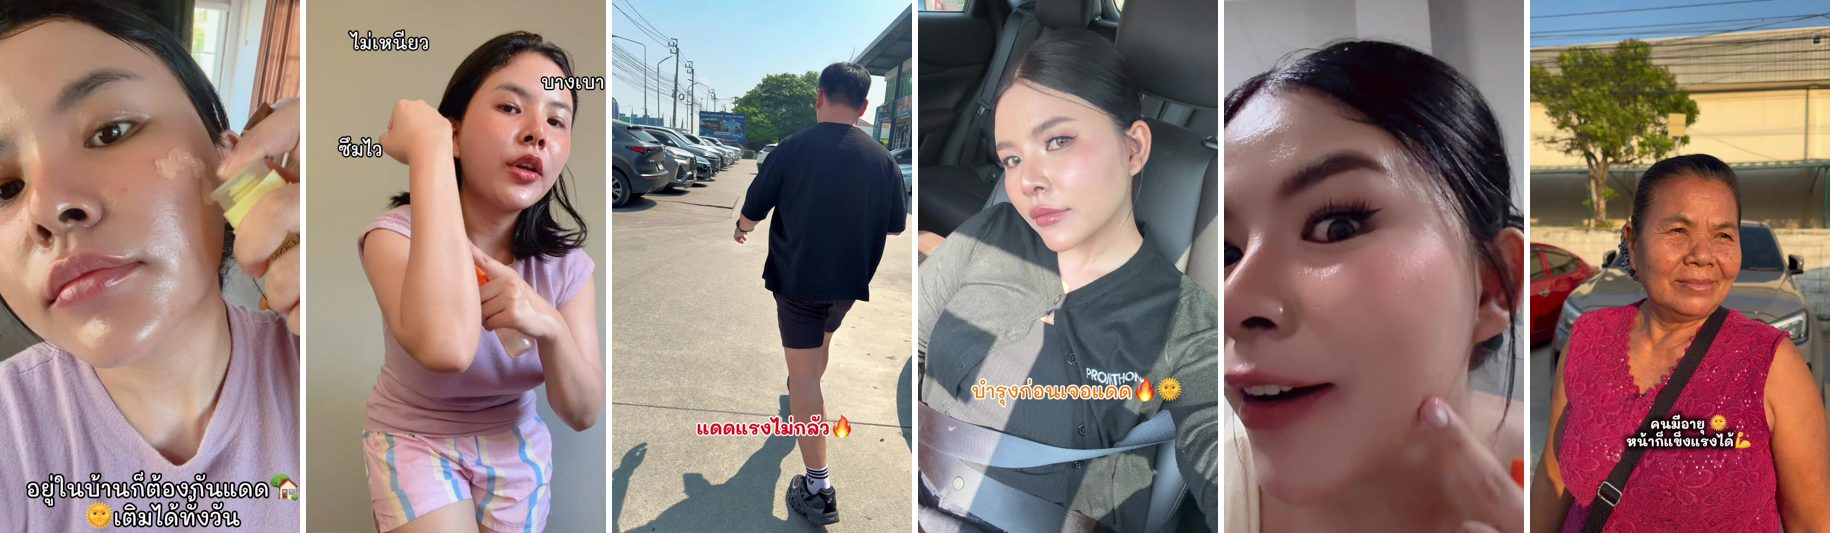
Between June 2025 and June 2026, one Thai TikTok account posted 192 videos about Iceler Skin, a skincare brand sold through TikTok Shop in Southeast Asia. It posted on 95 separate days, up to ten times in one day. Nearly every video carried a shop link. More than half drew under 1,000 views; one drew 910,400. Over part of the same period the account also posted 68 videos about Dr. Lan, a competing skincare brand.
CeraVe’s 2,118 captured posts from US accounts over eighteen months came from 1,239 accounts. None of them posted about the brand twenty times.
Accounts that posted at least twenty times supplied 64% of Iceler Skin’s captured posts from Thai accounts. For CeraVe in the US they supplied none. The two are different brands in different countries, and the comparison is not a ranking. It shows that a brand’s post count can be built in very different ways.
unrandom’s archive records which account made each post, when, and whether it carried a shop link. Almost all the posts in it carry one of TikTok’s commercial markers, so it describes promotional activity, not everything said about a brand. This article uses those records to ask who keeps posting about a beauty brand: how many accounts, how often, and what their posts are.
Most accounts post once
The analysis covers 600,450 TikTok posts associated with 397 beauty and skincare brands between January 2025 and June 2026, made by 58,562 accounts. Posts from a brand’s own accounts are left out. A group is one brand in one creator market, such as CeraVe in the US; 851 groups have at least 100 posts and ten accounts.
In the typical group, 57% of the accounts posted about the brand once. Half of the group’s posts came from 19% of its accounts.
We call an account heavy for a brand when it made twenty or more posts about that brand in one market during the eighteen months. Heavy accounts are unevenly spread. In 402 of the 851 groups no account reaches twenty posts. In 125 groups heavy accounts supply more than a quarter of the posts, and in 40 they supply more than half.
UNRANDOM / TIKTOK · 851 BRAND–MARKET GROUPS · JANUARY 2025–JUNE 2026
Nearly half of brand–market groups have no heavy accounts
How much of a brand’s volume comes from heavy accounts ranges from most of it to none. They supplied 81% of the captured posts about Based, a hair-care brand, in the US; 73% of posts about Dr. Lan in the Philippines; 64% for Iceler Skin in Thailand; 54% for P.Louise, a British makeup brand, in the UK. For Maybelline in the US the figure is 12%, and for CeraVe and Garnier in the US it is zero.
Three kinds of heavy account
A count of twenty posts says nothing about what the posts are. Three things in the records separate the heavy accounts: whether a post carries TikTok’s shop link, whether the account’s videos repeat one another, and how the caption is written. There are 3,179 pairings of a heavy account with a brand, covering 127,310 posts. We sorted each with fixed rules, applied in order.
- At least half the account’s posts about the brand share both their caption and their length in seconds with another of its posts. We call these repeated clips.
- Otherwise, fewer than half the posts carry a shop link. We call these product lists, after what the captions we read turned out to be.
- Otherwise, a shop link is on at least half the posts. We call these sellers.
The rules are mechanical; no model assigned the categories. The names come from reading captions and covers for samples of each group, described below. A rule can misplace an account: a matching caption and length marks a probable repeat, not a verified identical video, and an account without shop links is not always a makeup creator.
UNRANDOM / 127,310 POSTS BY HEAVY ACCOUNTS
Sellers make three-quarters of them
MEDIAN VIEWS PER POST · TYPICAL ACCOUNT OF EACH KIND
Product lists are watched far more
Views are counts recorded when the archive captured each post, not unique viewers. Download data (CSV)
Sellers
Sellers account for 2,311 of the pairings and 76% of the posts. In the ones we read, each video shows one product and attaches the shop link. The Thai account in the opening is one. Its covers from a single week show a sunscreen spray used in a car, beside a river, on a relative’s arm, in a car park. The product stays the same and the scene changes.
About a fifth of the sellers (436) post in bursts: at least one post in five went up within ten minutes of the account’s previous post about the same brand. An account in the Philippines posted three Dr. Lan videos in eight minutes on February 27, 2026, one on a lash serum, one on a two-product set and one on hair care. They drew 35,900, 253 and 1,296 views.
The typical seller’s median post draws 1,447 views. The Thai account in the opening has a median of 697 and one video at 910,400. A seller’s output is a long run of similar attempts, of which a few are widely seen. The records cannot show which posts produced sales.
Dr. Lan’s Philippine volume is built this way: 8,886 of its 12,653 posts came from heavy sellers. So is Iceler Skin’s in Thailand, and 10,344 of Medicube’s 25,121 posts in the US.
Across all 684,571 brand–post records, heavy sellers made 14% of the posts and received 3% of the recorded views.
Product lists
The 803 pairings in the second group rarely carry a shop link, and the typical account’s median caption tags three other accounts; some tag a dozen. The ones we read are makeup creators who film themselves getting ready and credit every product they use.
One British creator posted 51 videos that named Huda Beauty between December 2025 and June 2026. Her captions tag a median of twelve accounts each, nearly all of them brands, and over the eighteen months she named 26 beauty and skincare brands. Huda Beauty’s competitors are in the same videos: Maybelline appears in 30 of her posts. None of the Huda Beauty posts carried a shop link. Her median post drew 14,300 views.
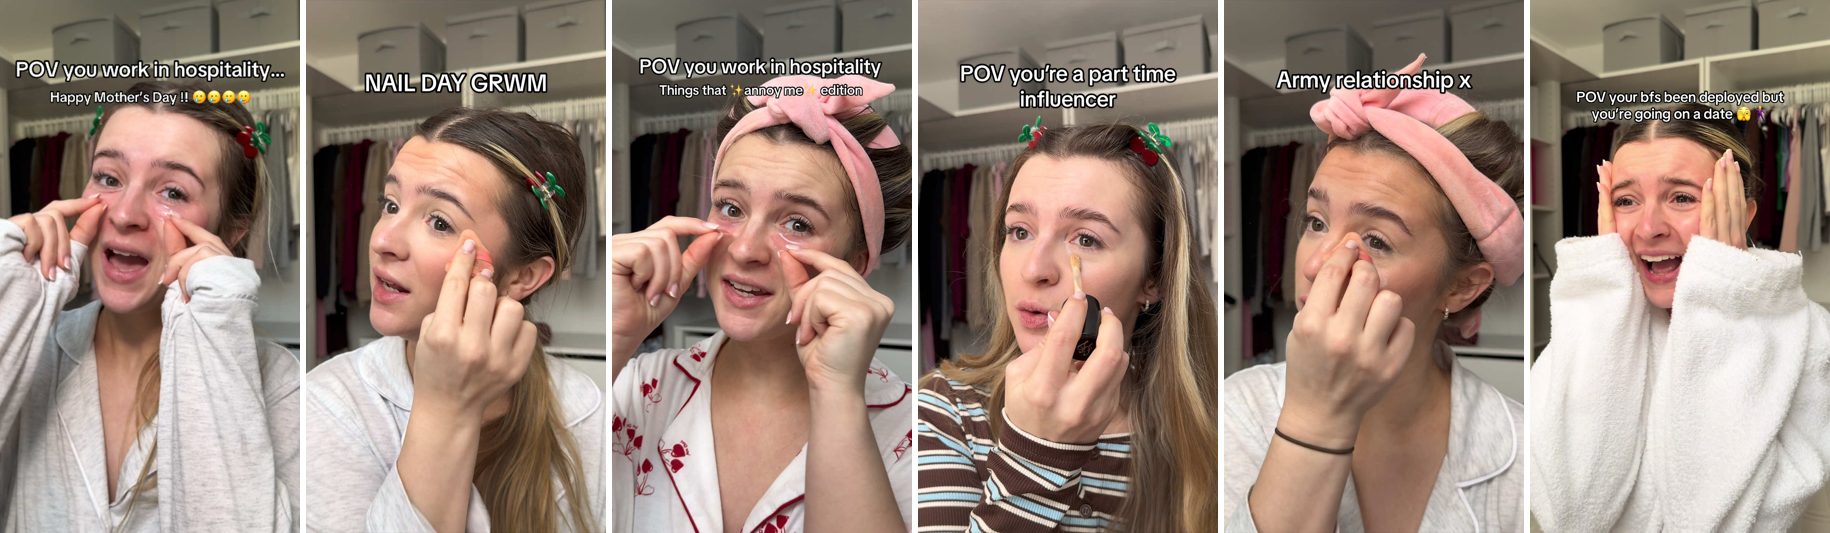
In these videos the brand is one item in a routine. The typical product-list account named 22 beauty and skincare brands in the period, against seven for the typical seller. The view counts are much higher: the median account of this kind draws 12,600 views per post, almost nine times the seller figure.
Some brands’ heavy accounts are all of this kind. Rhode has 3,315 captured US posts from 933 accounts; 788 came from heavy accounts and none of those was a seller. Huda Beauty in the UK has 1,161 heavy-account posts from product lists and 54 from sellers. The records do not show whether a creator was paid, sent products or bought them.
Repeated clips
The third kind is small: 65 pairings and 4,160 posts, 3% of the heavy-account total. It is concentrated in one place. Thirteen accounts posting about Based in the US made 1,508 such posts, a fifth of everything captured for the brand there.
One of them posted 60 Based videos in sixteen days in January 2026, 25 of them in one day. Twenty-seven of the 60 carry one caption, the words “crazy sale” and five hashtags; the account used eleven captions in all. The covers show the product on a kitchen counter or a shopping page on a monitor, with a line of text about the discount. No person appears. The median post drew 155 views.
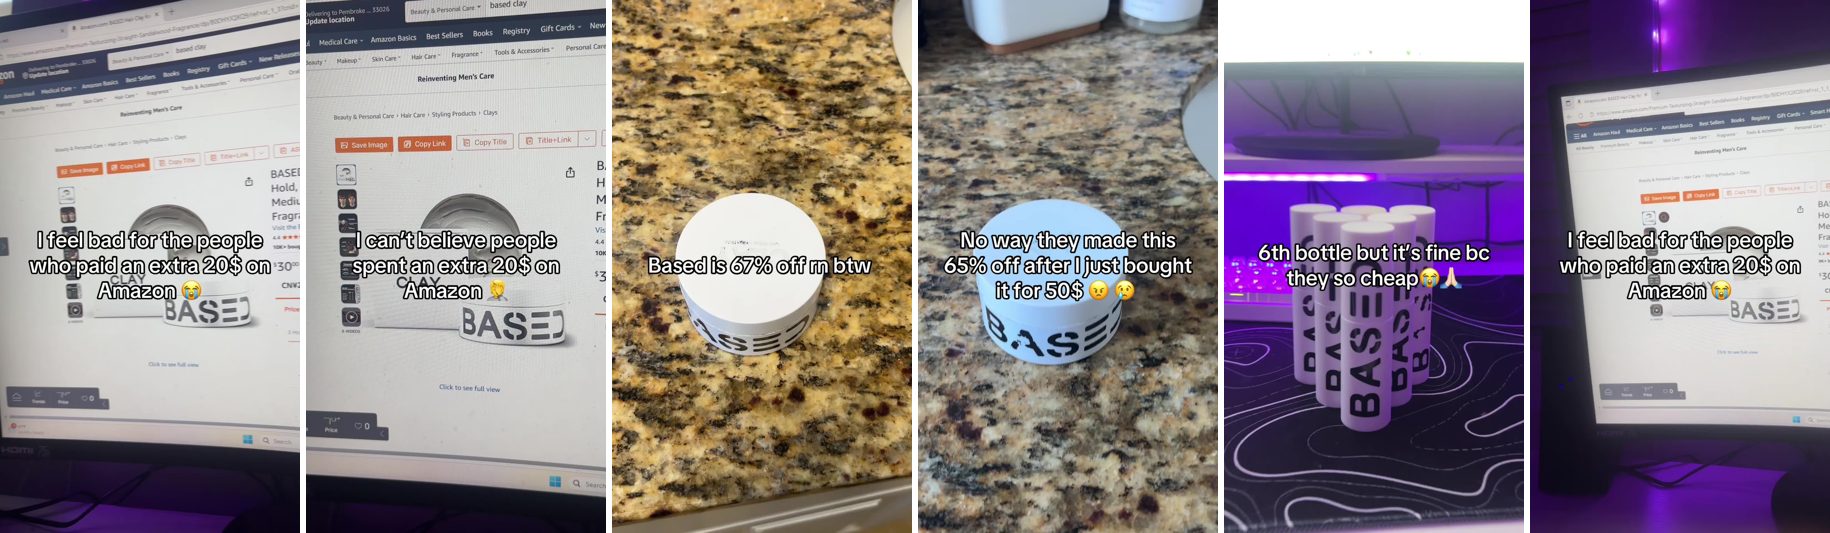
The typical repeated-clip account draws 439 views per post. These accounts supplied 21% of Based’s captured US posts and 0.5% of the views recorded on them.
The same total, made differently
Putting the three kinds beside each brand’s other posts shows how differently the totals are built.
UNRANDOM / TIKTOK · SELECTED BRAND–MARKET GROUPS · JANUARY 2025–JUNE 2026
What each brand’s posts are made of
Accounts with under 20 postsSellersRepeated clipsProduct lists
Dr. Lan’s heavy accounts are sellers posting a product and a link. Rhode’s are makeup creators who include a Rhode blush in a list of ten products. A post count treats a seller’s eighth video of the day and a creator’s get-ready routine as the same unit.
P.Louise shows that a single account can mislead. Its most prolific UK account, with 248 posts, tags the brand’s accounts and its loyalty scheme in nearly every caption, and reads as a fan account. Of P.Louise’s 71 heavy accounts in the UK, three use the loyalty hashtags. The rest are overwhelmingly sellers.
Rival brands share the same accounts
A heavy account is rarely one brand’s alone. In any quarter in which a heavy account was active for a brand, it posted for a median of four other beauty or skincare brands.
For some pairs of brands the overlap is large. In Thailand, 199 accounts are heavy for Dr. Lan or for Iceler Skin, and 77 of them are heavy for both. The account in the opening is one of the 77. In the US, 40 of the 294 accounts heavy for Dr. Melaxin or Medicube are heavy for both.
UNRANDOM / TIKTOK · ACCOUNTS WITH 20+ POSTS FOR EACH BRAND · SAME CREATOR MARKET
Accounts that are heavy for two brands
Skincare brands whose volume comes from sellers share sellers. L’Oréal Paris and Maybelline, or Maybelline and NYX, share makeup creators who list both. A brand whose posts come mainly from sellers is drawing on accounts that also post for its direct competitors. Sharing an account is not evidence of an arrangement between the brands or of any contract with the account.
The heavy accounts change within a year
Brandotomy’s article on Chinese brands found that accounts whose posts about a brand span at least thirty days supply about half of a typical group’s posts. The quarterly records add what happens after that.
For each of 273 groups with enough activity in four consecutive quarters, we took the accounts that supplied the top half of the group’s posts in a quarter and checked whether they were in that set in later quarters. In the typical group, 25.5% were still there the next quarter and 9.3% a year later. Groups with the most concentrated posting keep slightly more the next quarter, 32.5%, and no more after a year, 9.0%.
UNRANDOM / TIKTOK · 273 BRAND–MARKET GROUPS · QUARTERS, 2025–2026
In the typical group, 9% of main accounts are still main accounts a year later
Next quarterOne year later
Leaving that set does not mean an account stopped; it may have gone on posting at a lower volume. What the figures show is that the accounts supplying most of a brand’s volume in one quarter were mostly not the ones supplying it a year later, including for the brands that rely on them most. We tested whether an account’s later posts for a brand draw fewer views than its early ones. The decline appeared in some comparisons and vanished in others, so we do not report one.
What follows the country
One property of these accounts varies with where they are much more than with the brand: their size. Eighteen brands have enough captured posts in both the UK and the US in each month from January to June 2026 to compare directly. For every one of them, accounts under 100,000 followers made a larger share of the posts in the UK than in the US. The average is 73% in the UK and 49% in the US.
UNRANDOM / TIKTOK · 18 BRANDS · JANUARY–JUNE 2026
For all eighteen brands, UK posts come from smaller accounts
UKUS
A brand whose UK posts come mostly from small accounts has not necessarily chosen to recruit small accounts; in these records, so do the UK posts of the seventeen other brands. How concentrated a brand’s posting is among accounts does not show the same clean split. It follows the brand more than the country when the UK and US are compared, and that result does not hold once France is added. Most of the variation in concentration is explained by neither.
Reading a competitor’s numbers
Which of these a competitor’s total is made of can be read from outside, in who posted, how often and with what attached. Dr. Lan’s captured Philippine volume comes largely from accounts that repeatedly attach shop links, many of which post for Iceler Skin as well. Rhode’s repeat mentions in the US sit inside makeup routines beside other brands, and draw far more views per post. A fifth of Based’s US count drew 0.5% of its recorded views.
The archive records none of these brands’ recruitment, commissions or payments, and it cannot say which approach sold more.
Sources and method
Data. The analysis uses unrandom’s archive of TikTok posts associated with brands. The export covers 397 brands that the archive classifies as beauty or skincare, with posts dated January 1, 2025 to June 30, 2026: 685,820 brand–post associations, of which 1,249 from brand-run accounts were removed. That leaves 684,571 associations, 600,450 distinct posts and 58,562 accounts. A post that names several brands is counted once for each. Captions were available for 97.3% of posts.
What the archive holds. About 98% of these associations carry one of TikTok’s paid or commercial markers, so this is captured promotional activity and not every post that mentions a brand. Capture is incomplete and its probability is unknown. If a brand’s occasional mentions are less likely to be marked than its sellers’ posts, that brand will appear more concentrated here than it is. We could not test whether heavy accounts are simply accounts the archive captured in more depth; the per-account capture totals available were inconsistent with the post records and were not used.
Sensitivity. Moving the repeat or shop-link thresholds by ten to twenty points changes each kind’s share of heavy-account posts by at most 2.4 points. Defining heavy as ten or forty posts instead of twenty moves the product-list share by six to seven points in either direction. The burst figure is the most sensitive to its threshold.
Definitions. A group is one brand in one creator market. The market is where the account is located, not where viewers or buyers are. A heavy account has twenty or more posts for a brand in a market within the eighteen months. The three kinds are assigned by the rules stated in the article, in that order; a repeated caption must be at least twenty characters after lower-casing and collapsing spaces. The shop-link flag is TikTok’s marker for a post carrying a shopping anchor; it does not register links in a profile or sales elsewhere. A post’s brand association does not establish who paid for it, and the records contain no contracts, commissions or sales.
Heavy accounts. There are 3,179 pairings of an account with a brand and market at twenty or more posts, involving 2,347 accounts. A heavy account’s posting for a brand runs a median of 156 days between its first and last captured post, at about 2.8 posts in each week it is active. In the country comparison, the market accounts for about two-thirds of the variation in the share of posts from accounts under 100,000 followers and the brand for about a sixth.
Group statistics. The 851 groups have at least 100 posts and ten accounts. “Half of a group’s posts came from 19% of its accounts” is the median across groups of the smallest share of accounts that together supply half the posts. Views are point-in-time counts at capture.
Shared accounts, turnover and the country comparison. Shared accounts are those heavy for both brands in the same market. Turnover uses 273 groups with at least 50 posts and ten accounts in four consecutive quarters; a quarter’s core is the set of accounts, ranked by posts, that reaches half the group’s posts. Intervals from resampling groups are 23.7–27.2% and 7.4–11.3% for typical groups, and 29.1–35.9% and 4.2–15.5% for the most concentrated quarter of groups. The country comparison uses 18 brands with at least 50 captured posts in both the UK and the US in each of six months, and estimates brand, market and month effects together.
Independent checks. The frozen export was analysed separately by a second model (GPT Astra, run through Codex without database access), which chose its own methods for the concentration statistics, the brand-and-country comparison, turnover and the view-decay test. Its results are the source for the turnover and country sections and agreed with ours where the two overlapped. Two first-pass claims did not survive those checks: that concentration follows the brand more than the country, which held only for the UK–US comparison and is reported with that limit, and that an account’s later posts draw fewer views, which is not claimed.
Reading. Captions and covers were read for the named accounts and for samples of each kind. No video was watched in full. Account names are those shown on the public posts.
Research partnership: Brandotomy partners with unrandom and uses its campaign data to produce these findings through carefully harnessed agentic research frameworks. Brands and creators analyzed here are not thereby clients, partners or endorsers of unrandom or Brandotomy. See our editorial policy.
Campaign image ownership: Video covers are reproduced from public posts on TikTok, accessed through unrandom’s archive. Copyright and other rights remain with their respective creators and rights holders, including the platform where applicable. Brandotomy does not claim ownership. Accounts are credited beside each image. These archival images are distinct from the AI-generated editorial cover.
Written by Brandotomy Editorial.
Last reviewed Nov 02, 2026.